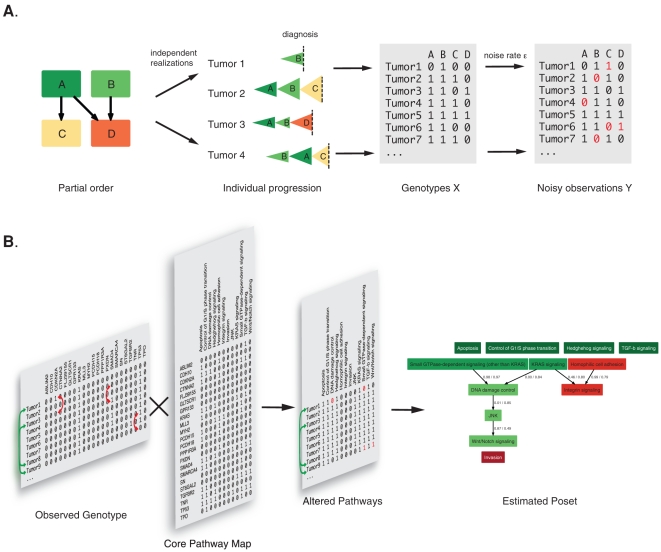
Figure 1. Schematic illustration of the H-CBN model and gene-to-pathway mapping.
A. Partial order constraints, as denoted by arrows, restrict the possible ordering in which mutations occur. In this example, mutation C arises only after A, and mutation D requires A and B to be present. Mutations A and B can occur in any order. Because the order is only partial, the sequence of events can differ between tumors. The accumulation of each mutation is described by a stochastic exponential waiting time process that corresponds to a clonal expansion. Each tumor thus arises by a series of expansions that differs across tumors depending on the number of constraints. No constraints imply that all orderings are possible; a linear (total) ordering corresponds to a single sequence of events for all cases. Tumors are examined at diagnosis and its genotype X indicates all functionally altered genes that have accumulated until then (1: altered, 0: functional). The observed list of mutated genes Y, however, can contain errors (red) due to incomplete data or wrong interpretation of the results. The most likely constraints and model parameters are estimated from the data Y. B. Mapping of genotypes to core pathways. The list of observed tumor genotypes is transformed to a list of altered core pathways by assuming that a pathway is altered if at least one member of that pathway is mutated. The order of core pathway alterations is then estimated using the H-CBN model. The influence of the gene-to-pathway mapping on the estimated constraints is analyzed by permuting genes among tumors (red arrows). To assess the stability of parameter estimates, bootstrap samples are drawn from the list of genotypes by sampling with replacement (green arrows) and the inference algorithm is run on each.

