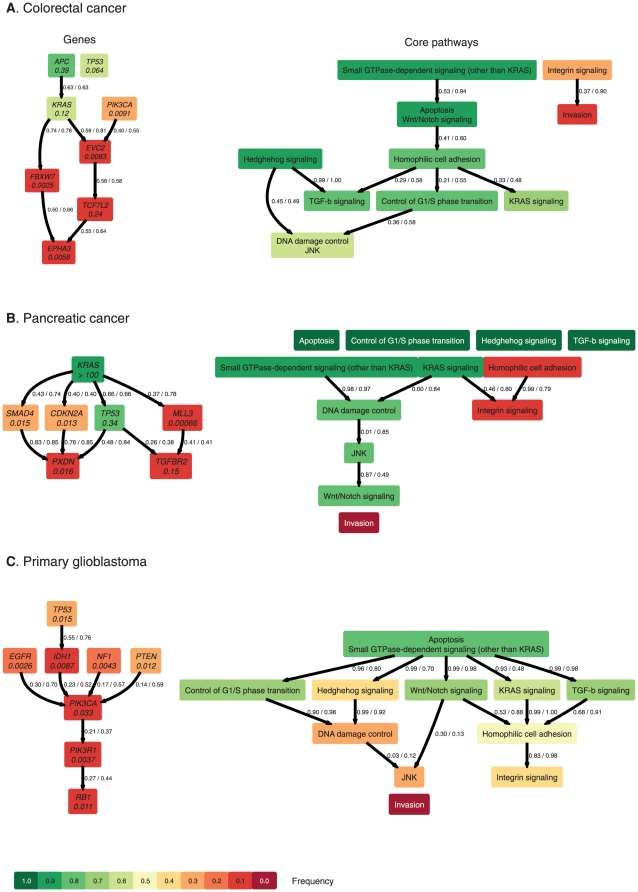
Figure 2. Most likely order constraints on the gene (left) and core pathway level (right) for colorectal cancer.
(A), pancreatic cancer (B), and primary glioblastoma (C). Each edge in the graph denotes an order constraint on the accumulation of alterations. The two values labeling each edge and separated by a slash denote relative frequencies of occurrence of the order constraint in permutation and bootstrap samples, respectively. The estimated yearly accumulation rates are given below the gene name at each node of the graph. The color of a node reflects the frequency of the alteration (dark green 100% to dark red 0%). Nodes labeled with white font have frequencies of exactly 100% or 0% and were not considered for the statistical analysis.

