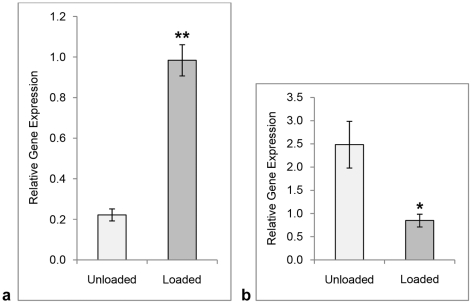
Figure 7. Results of loading on gene expression.
qPCR analysis for SP (a) and NK-1 R (b) mRNA, respectively, in cultured human primary Achilles tendon cells. The mean level of SP mRNA is significantly elevated after 2D-loading of the cultures, whereas the mean level of NK-1 R mRNA is significantly lowered after the loading. Error bars represent standard error of the mean. Level of significance: * p<0.05; **p<0.01 (Independent samples t-test).

