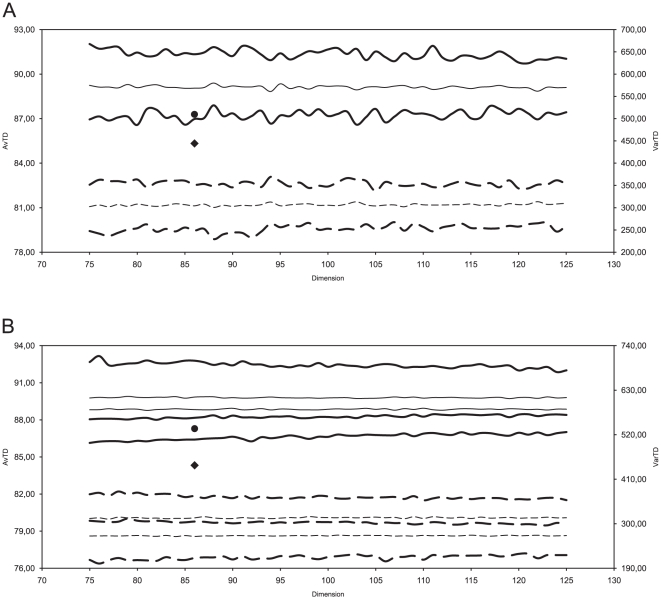
Figure 1. Phylogenetic Representativeness.
A, Average Taxonomic Distinctness (AvTD) and Variation in Taxonomic Distinctness (VarTD) computed for the sample used for this study. AvTD is plotted on left axis: the circle represents the value obtained from the present sample, whereas continuous lines indicate the lower 95% confidence limit, the maximum value for that sample dimension (thick lines), and the mean AvTD (thin line). VarTD is plotted on the right axis: the diamond represents the value obtained from the present sample, whereas dotted lines indicate the minimum value for that sample dimension, the upper 95% confidence limit (thick lines), and the mean VarTD (thin line). B, shuffling test with 100 randomly shuffled master lists (see text for details). Mean VarTD (thin dotted lines), upper 95% VarTD confidence limit (upper thick dotted lines), lower 95% AvTD confidence limit (lower thick continue lines), and mean AvTD (thin continue lines) are shown as the 95% confidence intervals across the replicates. Axes, circle, and diamond as above.

