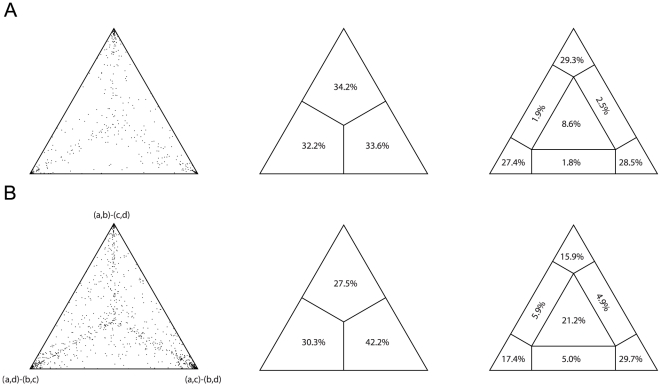
Figure 3. Likelihood Mapping.
Each analysis was performed on 1,000 random quartets; the left simplex shows point distribution; the central one the subdivision among the three corners; the right one the subdivision among Voronoi cells [96], [115]. A, Likelihood Mapping for the concatenated alignment without grouping. B, Likelihood Mapping for the concatenated alignment with Opponobranchia excluded and remaining taxa subdivided into Palaeoheterodonta (a), Anomalodesmata (b), Heterodonta (c), and Pteriomorphia (d). The three possible topologies are shown at vertices.

