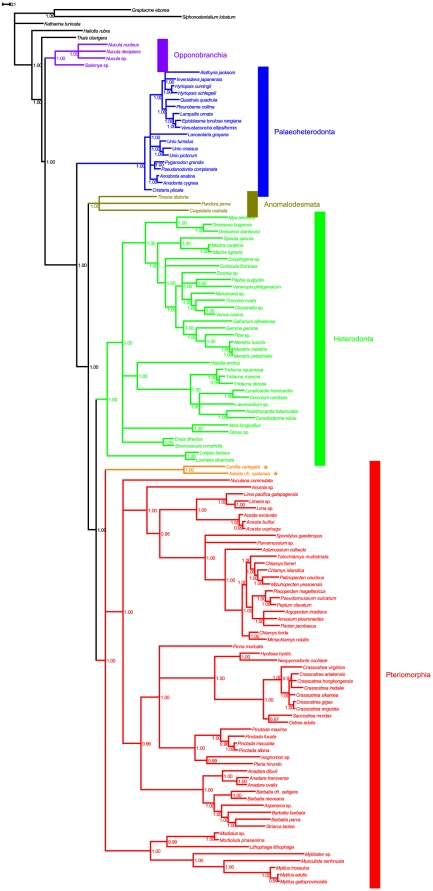
Figure 5. Bayesian Inference.
Shown is p14 tree, computed partitioning our dataset into ribosomal and protein coding genes; these were analyzed using the M3 codon model (see text for details). Values at the nodes are Posterior Probabilities (PP); nodes were collapsed if PP<0.95. Color code as follows: violet, Opponobranchia; blue, Palaeoheterodonta; brown, Anomalodesmata; green, Heterodonta; red, Pteriomorphia. Astartoidea and Carditoidea, previously classified as heterodonts and included hereafter among pteriomorphians, are shown in orange and marked with asterisks.

