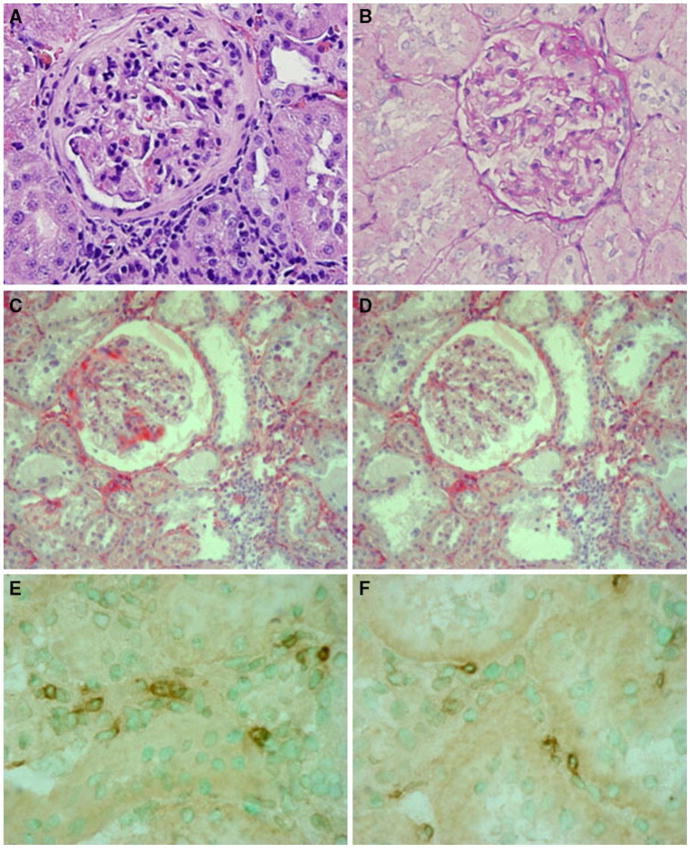
Fig. 4.
Histology and immunohistology of representative areas in the CRF group (a, c, e) and the CRF + HFED group (b, d, f). Light microscopy in a and b (PAS staining); collagen IV (alkaline phosphatase staining) in c and d and ED1 positive cells (macrophages) with immunoperoxidase staining in e and f. Structural changes in the CRF + HFED group had a wide range of variability, and differences did not reach statistical significance. Microphotographs shown in b, d and f correspond to biopsies with relatively minor damage

