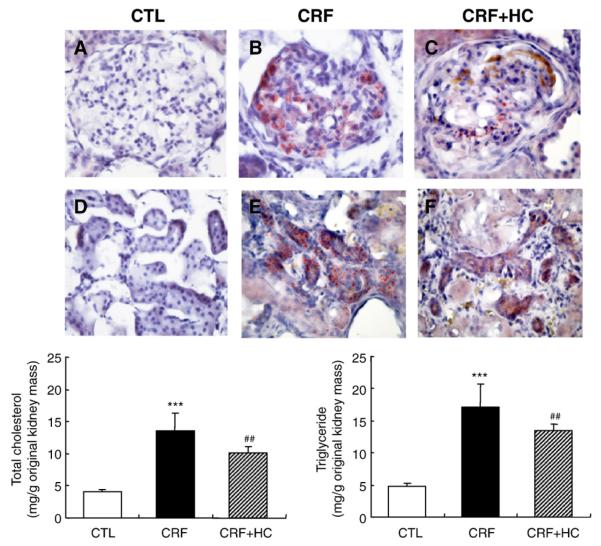
Fig. 1.
Top: Representative photomicrographs of the Oil-Red-O-stained glomerular and tubulointerstitial regions of the kidney in the control (CTL; A and D), CRF (B and E) and CRF groups fed the high-calorie diet (CRF+HC; C and F). Bottom: Bar graphs depicting tissue cholesterol and triglyceride contents expressed per gram of the original kidney mass in the CRF groups fed the high-calorie diet. ***P<.001 versus control groups; ##P<.01 versus 5/6 nephrectomized CRF groups.

