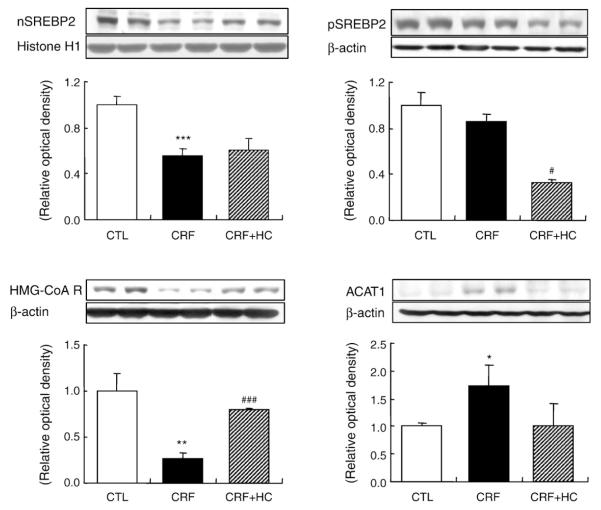
Fig. 3.
Representative Western blot analyses and group data depicting the protein abundance of precursor SREBP-2 (pSREBP-2), mature SREBP-2 (nSREBP-2), ACAT1 and HMG-CoA reductase in the renal tissues of CRF groups fed the high-calorie diet. *P<.05, **P<.01, ***P<.001 versus control groups; #P<.05, ###P<.001 versus 5/6 nephrectomized CRF groups.

