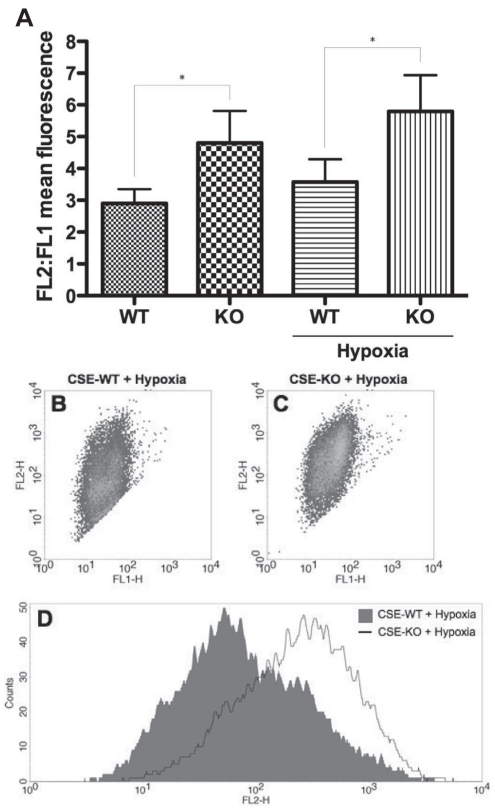
Figure 5).
Mitochondrial membrane potential assay (JC-1, Molecular Probes, USA). A Fluorescence flow cytometry JC-1 assay indicating mitochondrial membrane potential in cystathionine γ-lyase (CSE)-wild-type (WT) and CSE-knockout (KO) smooth muscle cells at 12 h hypoxia. *P<0.05. B and C Representative dot plots indicating FL2 versus FL1 fluorescence in the cell populations of hypoxic WT and KO samples. D Representative histogram indicating FL2 fluorescence versus cell counts of hypoxic WT and KO samples. H Height

