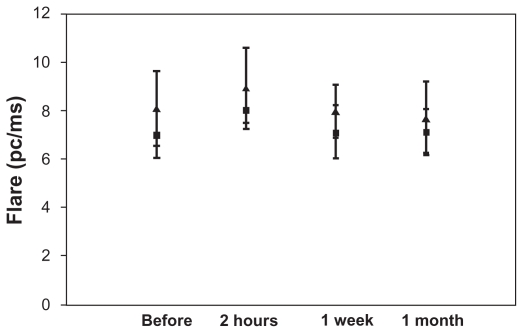
Figure 2.
Flare measurements in both groups at different time intervals after SLT treatment.
Notes: The bars represent 95% confidence intervals for the mean. (▴) represents the mean for the prostaglandin analogs group. (■) represents the mean for the non-prostaglandin analogs group. (t-test, before: P = 0.16; 2 hours: P = 0.14; 1 week: P = 0.12, and 1 month: P = 0.36).

