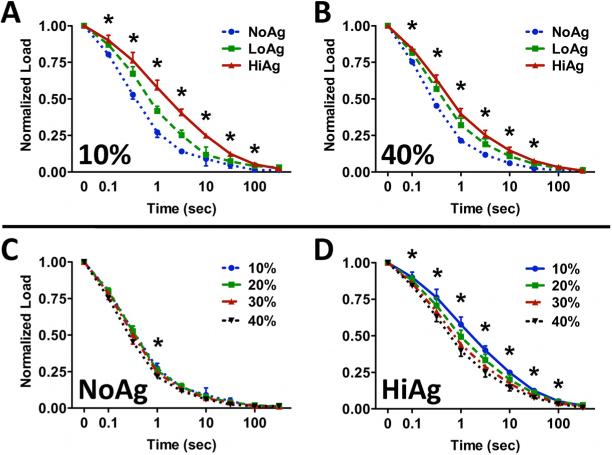
Figure 5.
(A, B) Relaxation curves under indentation demonstrate decreased relaxation rate with increasing agarose concentration, with differences between groups becoming less pronounced with increasing indentation depth; (C) NoAg samples do not exhibit a relaxation rate dependence on indentation depth, which is apparent for (D) HiAg samples (mean ± 95%CI; n=8/group, * for p ≤ 0.05)

