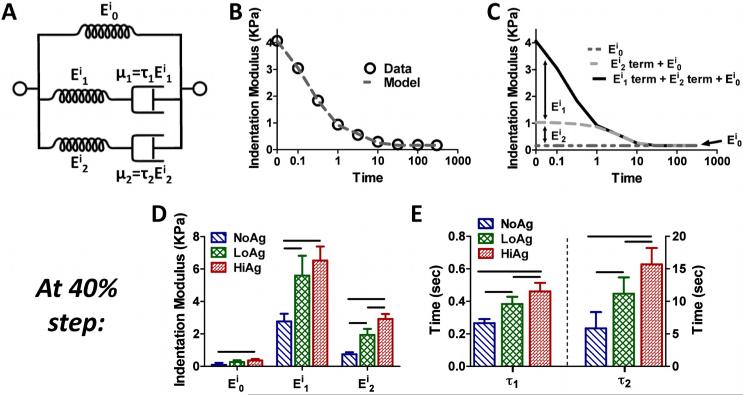
Figure 6.
(A) Schematic representing the two-relaxation-time solid linear model (Eij = elastic moduli; μj = material coefficients of viscosity; τj = relaxation time constants); (B) example model fit to experimental indentation modulus values; (C) evaluation of the data in (B) shows the relative contribution of each term of the solid linear model to the overall time-dependent Eitotal, specifically, the relaxed (Ei0), early-time (Ei1 term), and late-time (Ei2 term) components; both (D) elastic moduli and (E) relaxation time constants (shown at 40% displacement) increased with increasing agarose concentration (mean ± 95%CI; n=6-8/group; horizontal bar=significant differences)

