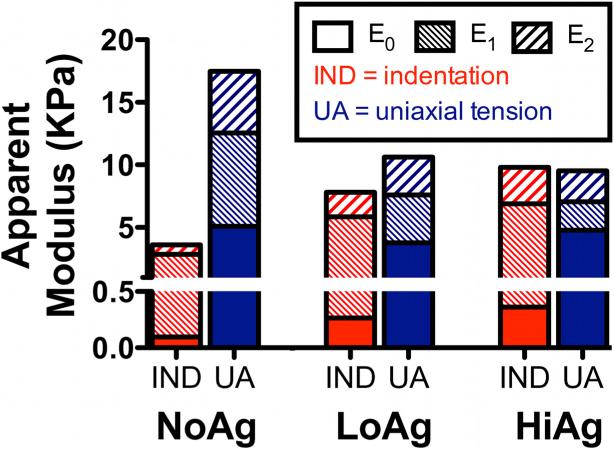
Figure 9.
Comparison of average modulus values from indentation testing (IND) and uniaxial tension (UA; published previously7) at the maximum displacement step (40% IND depth; 20% UA displacement), including relative contributions of each component of the total apparent modulus (E0 = equilibrium, E1 = early-time, E2 = late-time); several interesting observations can be made in comparing results among two different test modalities and across different sample compositions (see text for a more detailed discussion)

