Fig. 1.
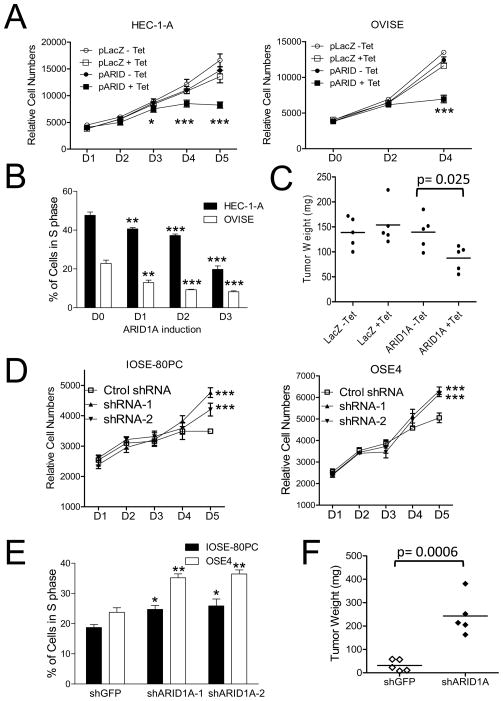
Effects of ARID1A on cellular proliferation and tumor growth. (A) A Tet-on inducible system was established in HEC-1-Aand OVISE cancer cell lines which harbor ARID1A inactivating mutations. Growth curve analysis shows that induction of ARID1A expression significantly decreases cellular proliferation as compared with the control groups without ARID1A expression. (B) Ectopic expression of wild-type ARID1A in HEC-1-A and OVISE leads to a decreased population of cells in S-phase. (C) ARID1A expression (ARID1A + Tet) significantly reduces the tumor weight of HEC-1-Atumor xenografts as compared to control tumors without ARID1A induction. (D) As compared to IOSE-80PC and OSE4 epithelial cells transduced with control shRNA lentivirus, cells transduced with virus expressing two different ARID1A shRNAs demonstrate significantly greater proliferation by day 5. (E) The percentage of cells in S phase is increased in IOSE-80PC and OSE4 cells transduced by ARID1A shRNAs (shARID1A-1 and shARID1A-2). (F) OSE4 cells transduced with ARID1A shRNA virus (shRNA 1) were injected into the subcutaneous tissue on the right flank of nu/nu mice, and control (Cont) shRNA virus transduced cells were injected into the left flank. Six weeks later, tumors arising from cells transduced with ARID1A shRNA are larger than tumors arising from cells transduced with control shRNA (p< 0.0006). For panelsA and B, statistical analysis was performed between ARID1A-induced and un-induced cells using t test. For panels D and E, statistical analysis was performed between ARID1A knockdown samples and control samples. *, p<0.05; **, p<0.01; ***, p<0.001 (t test).

