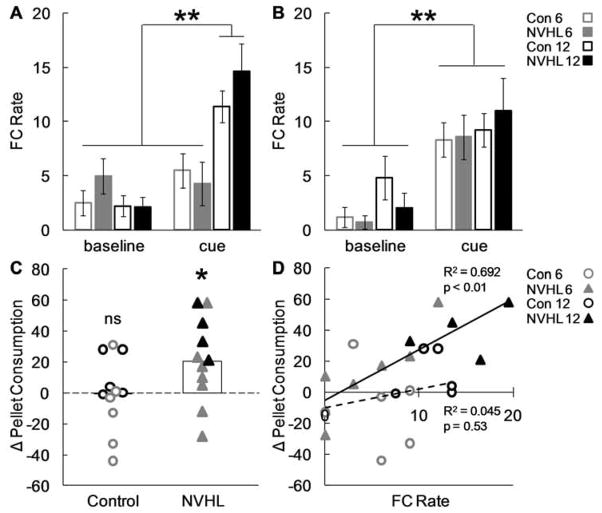
Figure 4.
Control and NVHL performance in representation-mediated taste aversion. (A) Mean ± SEM food cup rate during baseline and cue periods on the final day of conditioning are shown for Control (open bar) and NVHL rats (filled bar) that received 6 (grey) or 12 (black) light-sugar pairings. (B) Mean ± SEM food cup rate during baseline and cue periods for light-nausea pairings. (C) Change in consumption following light-nausea pairings is plotted for all individuals: Control (open circle), NVHL (filled triangle), 6 (grey), 12 (black). The more positive the number the greater the taste aversion that was formed. When necessary data points were jittered along the x-axis to avoid overlap. White bars indicate group means for Control and NVHL, collapsing 6 and 12 cue-sugar pairings. (D) The relationship between conditioned responding (x-axis) and the change in pellet consumption (y-axis) is plotted for Control and NVHLs. The trendline and the square of the correlation coefficient are shown for each group; Control: dotted line, NVHL: solid line. (ns = not significant, *p < 0.05, **p < 0.01)

