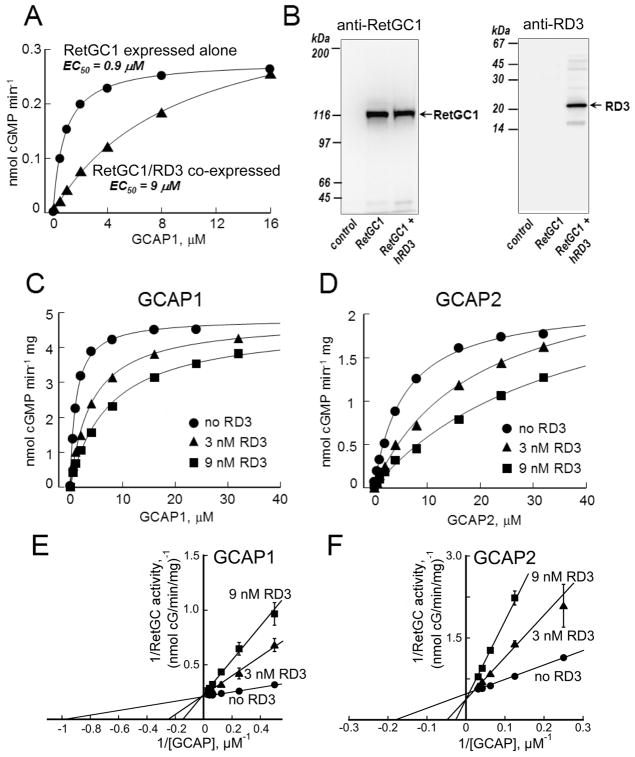
Fig. 2.
RD3 inhibits RetGC activation through competition with GCAPs. A. The guanylyl cyclase activity in HEK293 homogenates containing RetGC1 expressed alone (●) or co-expressed with human RD3 (▲) was assayed in the presence of added recombinant GCAP1. The data were fitted assuming Michaelis hyperbolic function, a=amax[GCAP]/(K1/2+(GCAP)); equalized by RetGC1 content in both samples. B. Immunoblotting. The cells expressing RetGC1, either alone or co-transfected with RD3, from panel A were probed with anti-RetGC1 (left) or anti-RD3 polyclonal antibody 497 (right). Non-transfected HEK293 cells (leftmost in each panel) were used as a specificity control. C–F. Competition of RD3 with GCAP1 and GCAP2 in RetGC assay. C, D. RetGC1 expressed in HEK293 cells was activated by purified GCAP1 (C) or GCAP2 (D) in the absence (●) or in the presence of 3 nM RD3 (▲) or 9 nM RD3 (■). The data were fitted by Michaelis hyperbolic function. Maximal RetGC1 activity (amax, mean ± SD) at 0 nm, 3 nM or 9 nM RD3 was 4.8 ± 0.13, 4.8 ± 0.11, and 4.6 ± 0.16 nmol/min/mg protein, respectively, when activated by GCAP1 and 2.1 ± 0.05, 2.6 ± 0.2 and 2.7 ± 0.1 nmol/min/mg when activated by GCAP2. The respective concentrations of GCAP producing half-maximal activation (K1/2) were 1.1 ± 0.12, 4.1 ± 0.6, and 7.5 ± 0.5 μM (GCAP1) and 5.9 ± 0.6, 19 ± 2.6, and 36 ± 1.5 μM (GCAP2). E, F. Double-reciprocal plots related to panels C and D, respectively.

