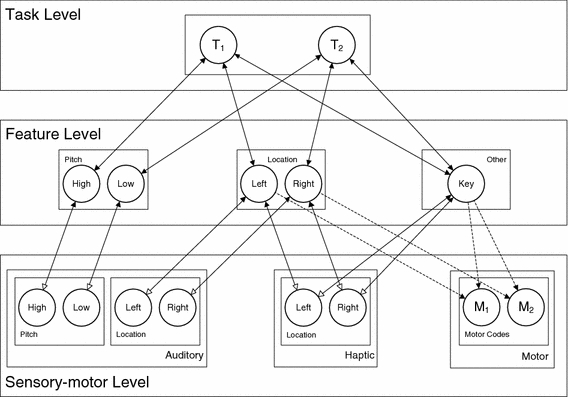
Fig. 1.

HiTEC architecture as used for simulation of the Simon effect (see “Simulations section”). Codes reside in maps on different levels and are connected by excitatory associations. Solid lines denote fixed weights, dashed lines are connections with learned weights. Sensory codes receive modulated excitation from feature codes, denoted by the open arrows
