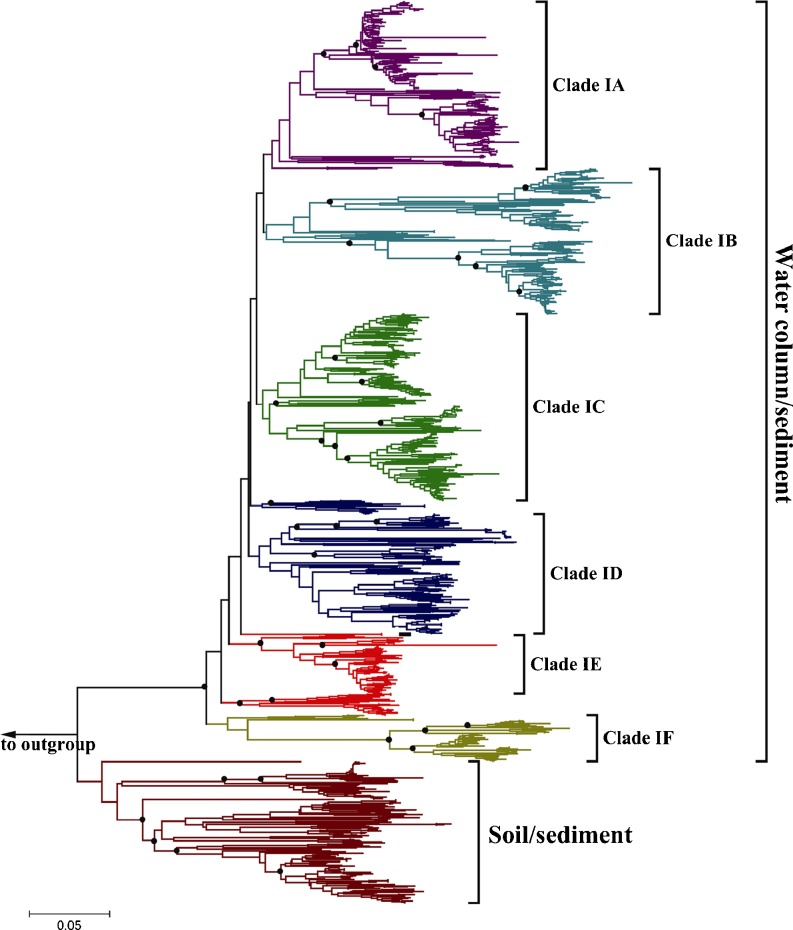
Figure 2.
Phylogenetic tree based on archaeal amoA gene sequences from the variable surface sediments in the western Pacific and most similar sequences using the neighbor-joining criterion. Filled circles at the nodes represent the significant bootstrap values (>50) through 500 resampling test. Branch lengths correspond to sequence differences as indicated by the scale bar

