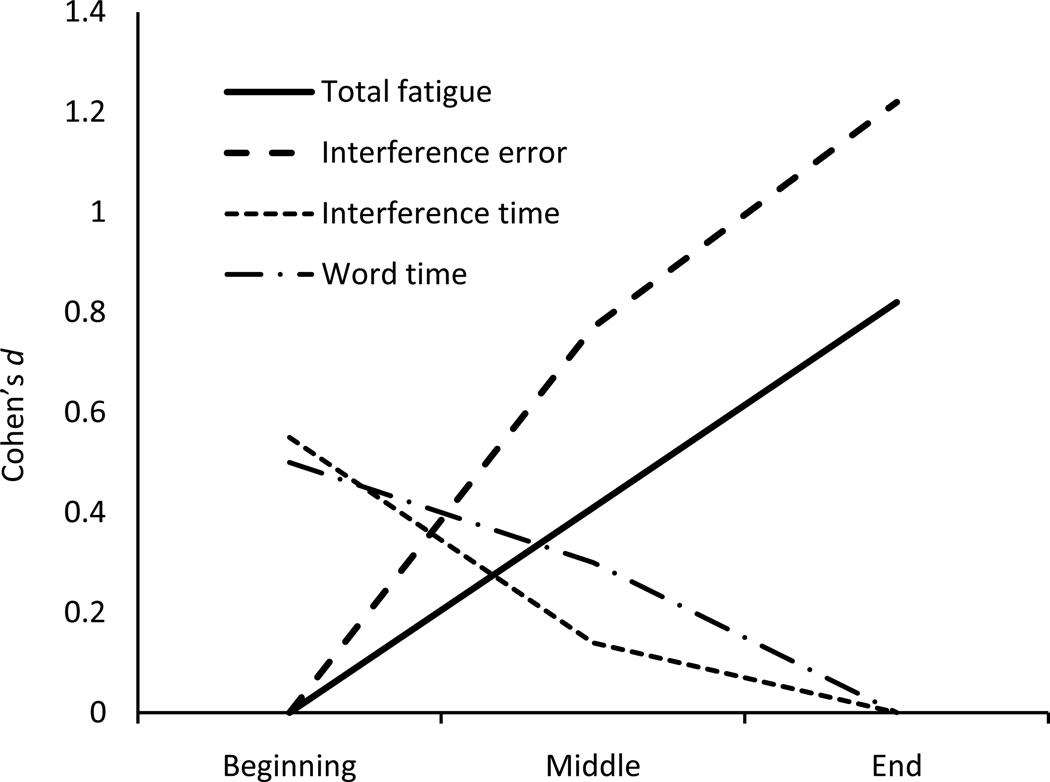
Figure 1.
Cohen’s standardized differences (Cohen’s d) at beginning, middle, and end of test battery for fatigue and neuropsychological performance variables. To show increasing or decreasing trends, Cohen’s d was calculated for Beatty total fatigue (Total fatigue), Stroop Color-Word Interference total errors (Interference error), and total completion time for both Stroop Color-Word (Word time) and Color-Word Interference (Interference time) conditions. Note: To show the increasing trend in total fatigue and in total errors, Cohen’s d was calculated using the formula (mean at other times – mean at beginning)/pooled standard deviation. To show the decreasing trend on total completion times, Cohen’s d was calculated using the formula (mean at other times – mean at end)/pooled standard deviation.

