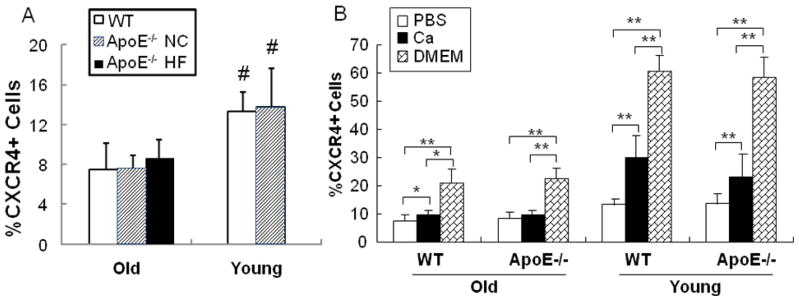
Fig 1. Comparison of CXCR4 expression in BMCs from young vs. old WT or ApoE−/− mice.
A). BMC isolated from young and old WT (□)or ApoE−/− mice under either high fat diet (▨) or normal chow (■) were labeled with PE-conjugated anti-CXCR4 mAb. The surface CXCR4 positive BMCs were quantified through flow cytometry and expressed as percentage of total BMCs. # p<0.05 vs. Old groups. B). BMCs were incubated in PBS, PBS plus CaCl2 (1mM) or DMEM containing 10% FBS at 37°C for 4 hrs and CXCR4+ BMCs were then quantified by FACS analysis. n=10. * p<0.05; ** p<0.01.

