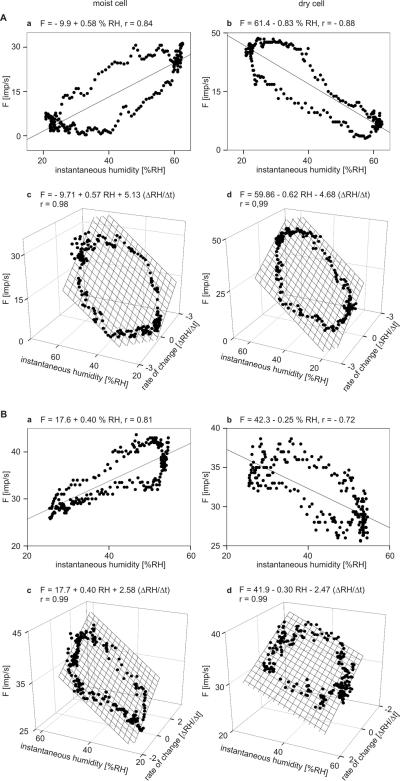
Fig. 6.
A and B: Impulse frequency of the moist and dry cells as function of instantaneous humidity, and as function of both instantaneous humidity and rate of humidity change. A: cockroach. B: stick insect. a impulse frequency of a single moist plotted against instantaneous humidity. b impulse frequency of a single dry cell plotted against instantaneous humidity. Stimulus-response functions approximated by linear regressions (F = a + bRH; where F is the impulse frequency, a the height of the regression line, and b the slope of function indicating the mean change in impulse frequency for each percent change in instantaneous humidity). c impulse frequency of the same moist cell as in a plotted against instantaneous humidity and its rate of change. d impulse frequency of the same moist cell as in b plotted against instantaneous humidity and its rate of change. Multiple regressions which utilize 3-dimensional planes (F = a + bRH + c dRH/dt; where F is the impulse frequency, and a the height of the regression plane) are calculated to determine the simultaneous effects of instantaneous humidity (b-slope) and the rate of humidity change (c-slope) on the response frequencies of both cells. RH relative humidity, r correlation coefficient

