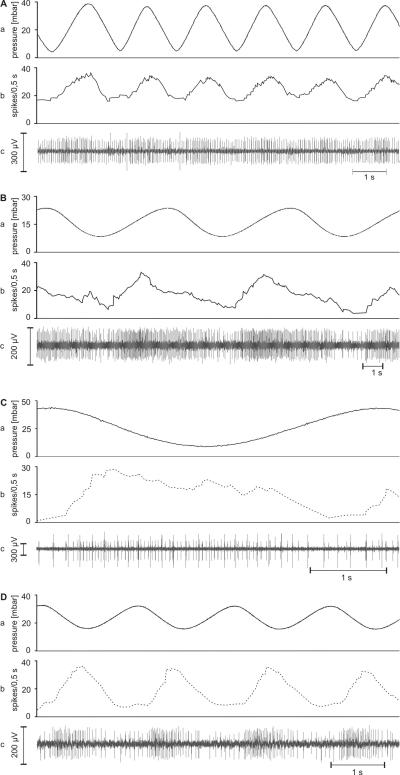
Fig. 8.
A-D: Examples of the responses of the stick insect’s moist and dry cells to slow and continuous pressure changes. A and B: moist cells from different recordings responding to increasing pressure. C and D: dry cells from different recordings responding to decreasing pressure. a time course of the air pressure; b time course of the mean frequency (bin width, 0.5 ms) of the a moist cell (solid line) and the dry cell (dotted line); c extracellular recorded activity

