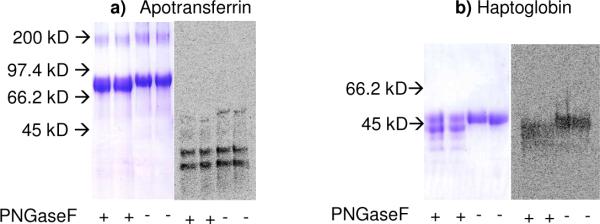
Figure 8. Autoradiography of apotransferrin and haptoglobin.
Apotransferrin (panel a) and haptoglobin (panel b) were sialylated using the exchange reaction. These proteins were treated with PNGaseF to remove N-glycans as indicated. 10 μg of each protein was then analyzed using SDS-PAGE with Coomassie blue staining being used to visualize protein and phosphorimaging being applied to monitor 14C-NeuAc incorporation. All samples were analyzed in duplicate.

