
Figure 8.
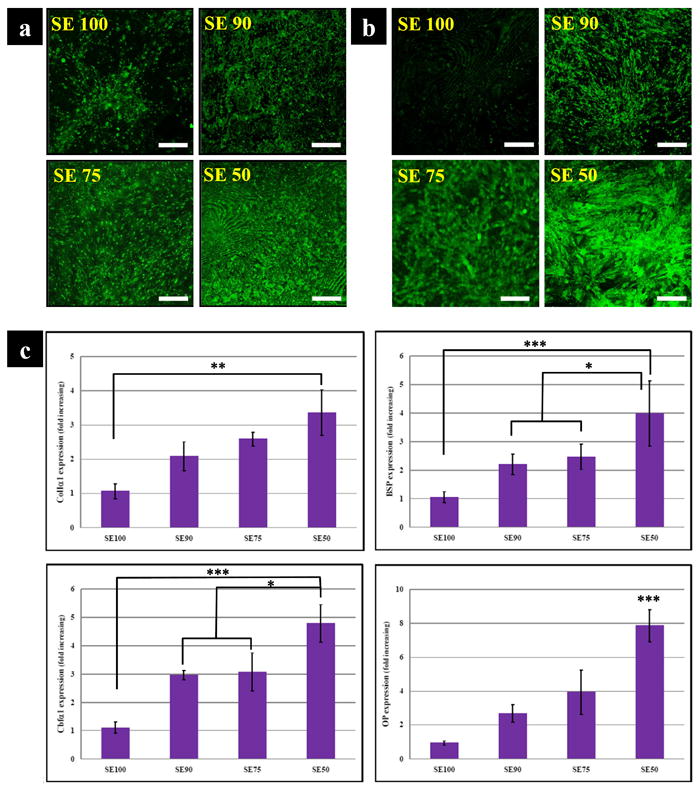
Marker expressions of osteogenic induced hMSC. Immunocytochemical staining of osteogenic related ECM (a) BSP (b) OP. SE50 exhibited stronger staining at 2 wk than SE100 for both BSP and OP. (Scale bars: 150 μm) (c) Profile of osteogenic transcript levels; colIα1, BSP, OP and Cbfα1. Col Iα1 transcript level on SE50 was upregulated at 2 wk when compared to SE100. At this time point, the mRNA levels of BSP and OP were higher overall on the tropoelastin blend silks than in SE100. (*p<0.05, **p<0.01, and ***p<0.001).