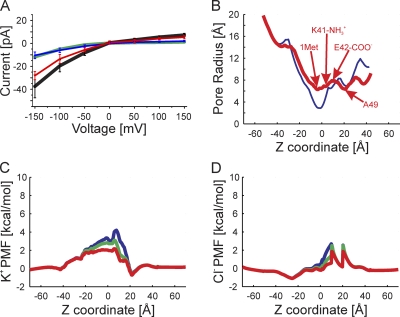
Figure 5.
GCMC/BD simulations of the average equilibrated structure. (A) The I-V relation obtained computationally for the multi-ion case (100 mM of symmetric KCl). The black line is the total current, the red line is the Cl− current, the blue line is the K+ current, and the green line is the total current of the completed crystal structure corresponding to Fig. S5 A. (B) The pore radius of the average equilibrated structure is shown in red, and the completed crystal structure is in blue. The positions of Cα of Met1, the amide group of K41, the carbonyl of E42, and the Cα of A49 are indicated. (C) The PMF of K+ at three voltages, 150 mV (blue), 0 mV (green), and −150 mV (red), are plotted against the z coordinate. The blue, green, and red lines are the PMF determined at 150, 0, and −150 mV, respectively. (D) The PMF of Cl− determined from simulations at the same three voltages.

