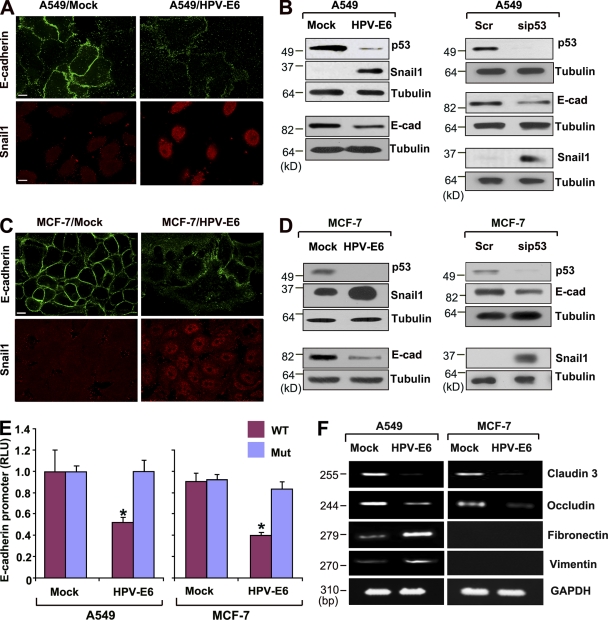
Figure 2.
E-cadherin and Snail1 expression after HPV-E6–dependent p53 degradation. (A) A549 cells were stably transfected with control (Mock) or HPV-E6 expression vectors. Cells were stained with anti–E-cadherin and anti-Snail1 antibodies for confocal imaging. Bar, 10 µm. (B) Endogenous p53, E-cadherin, and Snail1 levels were determined by immunoblot analysis in A549 cells transfected with control (Mock) versus HPV-E6 expression vectors, cells transfected with control versus p53-specific siRNA. Tubulin is used as the loading control. (C) MCF-7 cells were stably transfected with control (Mock) or HPV-E6 expression vectors. Cells were stained with anti–E-cadherin or anti-Snail1 antibodies for confocal imaging. Bar, 10 µm. (D) Endogenous p53, E-cadherin, and Snail1 levels were determined in MCF-7 cells as described above in B. (E) E-cadherin promoter activity of wt (blue) or E-box mutant (red) firefly luciferase constructs was determined in mock- or HPV-E6–transfected cells. Activity of the E-cadherin promoter construct was normalized to the activity of a cotransfected SV-40 promoter renilla luciferase complex. Results are expressed as the mean ± 1 SD (error bars; n = 3, *, P ≤ 0.01). (F) Claudin-3, occludin, fibronectin, and vimentin expression levels were determined by RT-PCR analysis in mock- or HPV-E6–transfected A549 as well as MCF-7 cells.

