Figure 4.
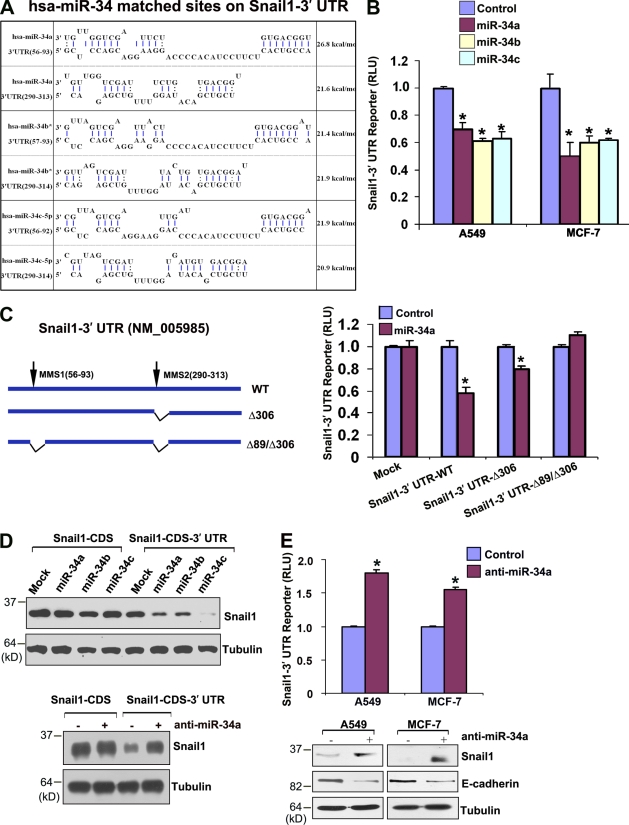
Snail1 is a direct target of the miR-34 family. (A) Predicted interactions between miR-34a, -34b, and -34c, and Snail1 3′ UTR sequences. Extended seed matches between the 5′ end of miR-34 family (miR-34a, -34b*, and -34c-5p) and the 3′ UTR binding sites of Snail1 (available from GenBank/EMBL/DDBJ under accession no. NM_005985) are shown. Binding energy was calculated by RNAhybrid. (B) Snail1 3′ UTR reporter activity repression by miR-34 family expression vectors. The Snail1 3′ UTR reporter construct cloned downstream of the firefly luciferase was transfected into A549 or MCF-7 cells with control or miR-34 family expression vectors. Activity of the 3′ UTR reporter construct was normalized to the activity of a cotransfected SV-40 promoter renilla luciferase construct after a 2-d culture period. Results are expressed as the mean ± 1 SD for three or more experiments (error bars; *, P ≤ 0.01). (C) Schematic diagram depicting firefly luciferase reporter constructs containing the wt Snail1 3′ UTR or deletion mutants of putative miR-34 family interaction sites (top). Each of the 3′ UTR reporter constructs was cotransfected with a synthetic control or miR-34a into MCF-7 cells, and normalized activity was assessed as described in A after a 2-d culture period. (*, P ≤ 0.01). (D) Immunoblot blot analysis of 293 cells transfected with FLAG-tagged human Snail1 expression vector without the Snail1 3′ UTR (Snail-CDS) or an expression vector harboring the Snail1 3′ UTR (nt +1 to +675; Snail-CDS 3′ UTR). The Snail1 expression vectors (300 ng each) were cotransfected with miR-34 family expression vectors (1 µg each) or anti–miR-34a oligonucleotides (40 pmol each). Whole-cell lysates were analyzed by immunoblotting with anti-FLAG monoclonal antibody after a 2-d culture period. Tubulin is shown as the loading control. (E) Transfection of A549 or MCF-7 cells with anti–miR-34a increased Snail1 3′ UTR reporter activity after a 4-d culture period as described in A, with results presented as the mean ± 1 SD (n = 3; *, P ≤ 0.01). Immunoblot analyses of Snail1 and E-cadherin protein expression levels were performed in A549 or MCF-7 cells 4 d after transfection with control or anti–miR-34a (bottom). Tubulin is shown as the loading control.

