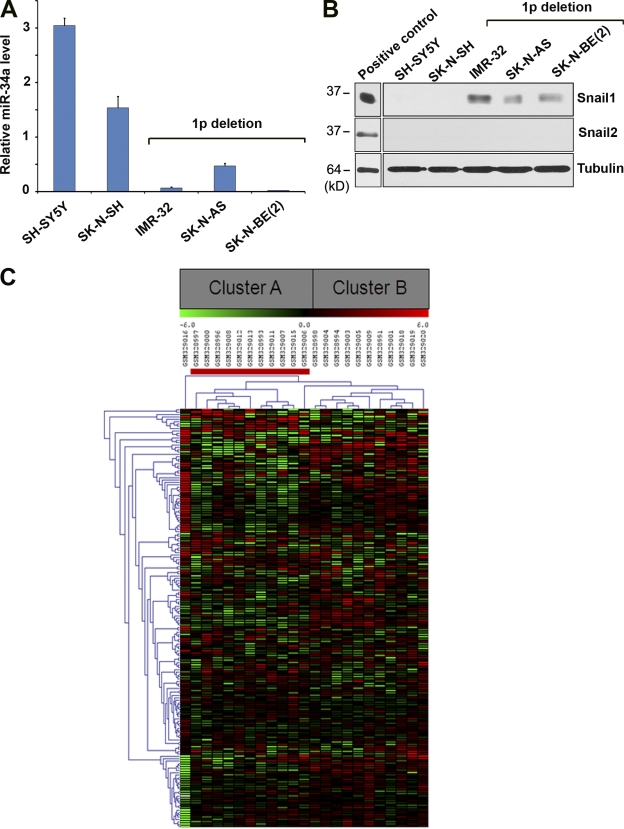
Figure 9.
Cluster analysis of neuroblastoma clinical cohort. (A) miR-34a expression levels in 1p36-positive and 1p36-deleted human neuroblastoma cells. (B) Snail1 and Slug/Snail2 protein levels in 1p36-positive and 1p36-deleted neuroblastoma cells as determined by Western blot analysis. Cell lines expressing recombinant Snail1 or recombinant Slug/Snail2 were used as positive controls. (C) Heat map shows average-linkage hierarchical clustering, using a Euclidean distance metric, performed on 23 neuroblastoma patient samples. Clinical samples harboring a deletion of chromosome 1p are indicated with a red bar. Two distinct clusters, A and B, are highlighted in the gray boxes.

