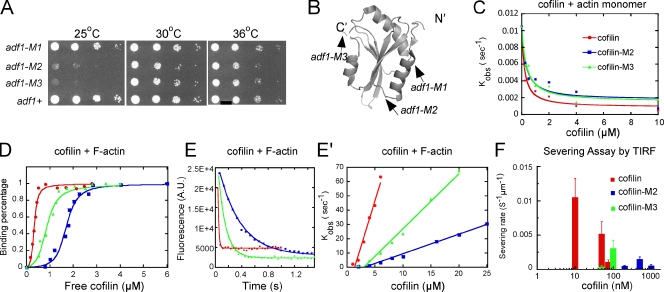
Figure 1.
Mutant cofilins with defects in severing actin filaments. (A) Growth of wild-type and mutant strains. Drops with 10-fold serial dilutions were plated on YE5s agar and grown for 4 d at 25°C, or for 3 d at 30 or 36°C. (B) Ribbon diagram of fission yeast cofilin (PDB: 2i2q) rendered by PyMol (DeLano Scientific). Arrows indicate sites of point mutations in adf1-M1 (P10A, E11A), adf1-M2 (K23A, S24A, R25A), and adf1-M3 (E132A, K133A). (C–F) Biochemical characterization of wild-type cofilin (red symbols and lines), cofilin-M2 (blue), and cofilin-M3 (green). (C) Dependence of kobs for dissociation of etheno-ATP from actin monomers in 1 mM MgCl2, 1 mM EGTA, 2 mM TrisCl, and 0.5 mM DTT, pH 8.0 on the concentrations of the three cofilins. The smooth curves are fits of the binding equation (Bryan, 1988; Hawkins et al., 1993) yielding the Kds listed in Table II. (D) Equilibrium binding of a range of cofilin concentrations to 2 µM pyrene-labeled actin filaments in KMEI polymerization buffer (50 mM KCl, 1 mM MgCl2, 1 mM EGTA, and 10 mM imidazole, pH 7.0) measured by fluorescence after 0.5 h incubation. The fraction bound was calculated from the fluorescence decrease relative to the maximum decrease. The free cofilin concentration was the total cofilin in the reaction minus the cofilin bound to the actin filaments. (E) Time course of 3 µM cofilin binding to 1 µM pyrene-labeled actin filaments in KMEI polymerization buffer measured by the decrease in fluorescence. Fits of a single exponential equation to the data gave observed rate constants (kobs) of 73.6 s−1 (wild type), 3.0 s−1 (cofilin-M2), and 8.9 s−1 (cofilin-M3). (E′) Concentration dependence of kobs for cofilin binding to 2 µM pyrene-labeled actin filaments in KMEI polymerization buffer. Each data point is an average of kobs for at least three reactions. (F) Cofilin concentration dependence of the actin filament–severing rate in TIRF buffer observed by total internal reflection fluorescence (TIRF) microscopy (see Fig. S2 E). Severing of actin filaments by 200 nM cofilin-M3 was negligible. Error bars represent the standard deviations.

