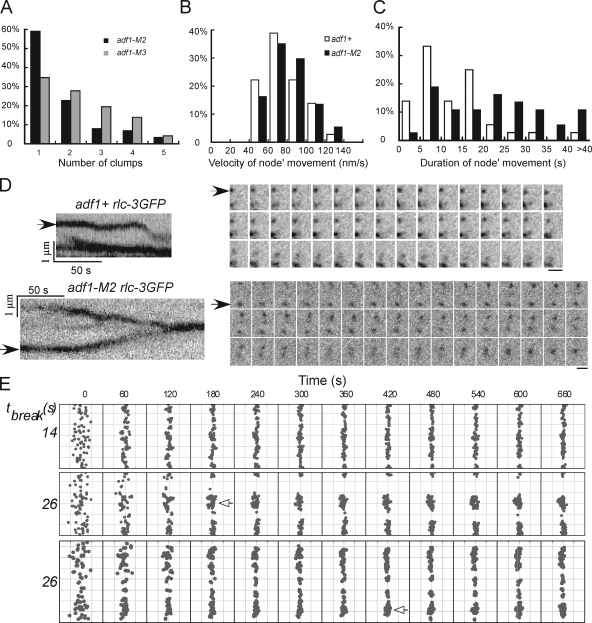
Figure 5.
Measurements and simulations of node movements in wild-type and cofilin mutant cells. (A) The numbers of clumps of nodes stationary for ≥10 min in adf1-M2 (black, n = 88) and adf1-M3 (gray, n = 72) cells. (B) Histogram of the distribution of the durations of node movements in wild-type (unfilled, n = 36) and adf1-M2 (black, n = 37) cells. (C) Histogram of the distributions of node velocities in wild-type and adf1-M2 cells. A–C are based on data from single experiments, exacted from multiple image sets acquired independently. (D) Time-lapse fluorescence micrographs of moving nodes in an adf1+ cell (top) and an adf1-M2 cell (bottom). Intervals between frames are 3 s. Left, kymographs of each time lapse series made as in Fig. 4 C. The node in the adf1+ cell (arrow) alternated between pauses and directed movements, while the node in the adf1-M2 cell (arrow) moved for a much longer time. Bars, 1 µm. (E) Snapshots of Monte Carlo simulations of the search-capture-pull and release model of contractile ring assembly (Vavylonis et al., 2008). Top two rows show simulations with a cell radius of 1.8 µm and two values of τbreak, based on node movements in adf1+ (14 s) and adf1-M2 (26 s) cells. The bottom row is a simulation with τbreak = 26 s and the radius of cofilin mutant cells, 2.4 µm. The equator of the cell is filleted open with the circumference vertical for display. The 65 nodes in the broad band are indicated as gray dots. Nodes form clumps (empty arrows), with τbreak = 26 s. The numbers on the top are times in seconds. Representatives from multiple simulations are shown.

