Figure 7.
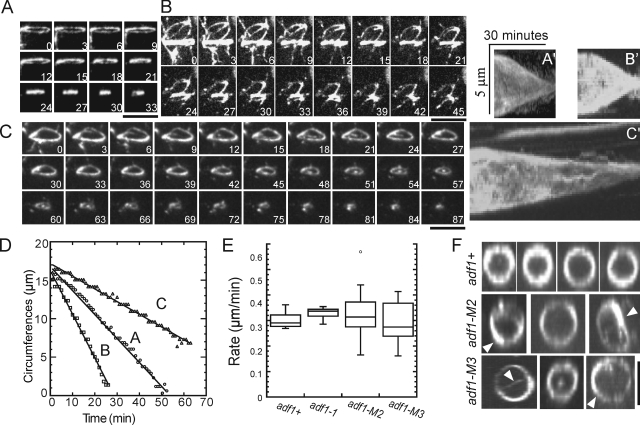
Contractile ring constriction in wild-type and cofilin mutant cells. Time courses of contractile ring constriction observed by fluorescence microscopy of adf1-M2, adf1-M3, adf1-1, and wild-type strains expressing Rlc1p-3GFP at 25°C. Bars, 5 µm. (A–C) Time series of maximum intensity projections of fluorescence images of three adf1-M2 rlc1-3GFP cells. Numbers are times in minutes from the beginning of the recordings. (A′–C′) Kymographs of ring constriction by cells A, B, and C constructed by projecting fluorescence of the rings onto a time line. (D) Time course of changes in contractile ring circumference calculated from projection images for cells A–C. Constriction rates: (A) 0.31 µm/min; (B) 0.56 µm/min; (C) 0.16 µm/min. (E) Box plots of contractile ring constriction rates. The horizontal line in the box is the median. The top and bottom of the box include ± 25% from the mean value of the population. The lines extending from the top and bottom of each box mark the minimum and maximum values except for one outlier (displayed as a single point), which exceeded the median ± the inter-quartile value. Average constriction rates were indistinguishable in these four strains: 0.30 ± 0.03 µm/min (wild type, n = 14), 0.33 ± 0.02 µm/min (adf1-1, n = 13), 0.32 ± 0.10 µm/min (adf1-M2, n = 17), and 0.30 ± 0.08 µm/min (adf1-M3, n = 11). Variances were larger for adf1-M2 and adf1-M3 cells than for wild-type cells. (F) Contractile rings reconstructed from Z-series of fluorescence micrographs. Contractile rings in adf1-M2 and adf1-M3 cells were less homogeneous with some thicker bundles (arrowheads) than wild-type adf1+ cells. Bar, 5 µm.

