Figure 1.

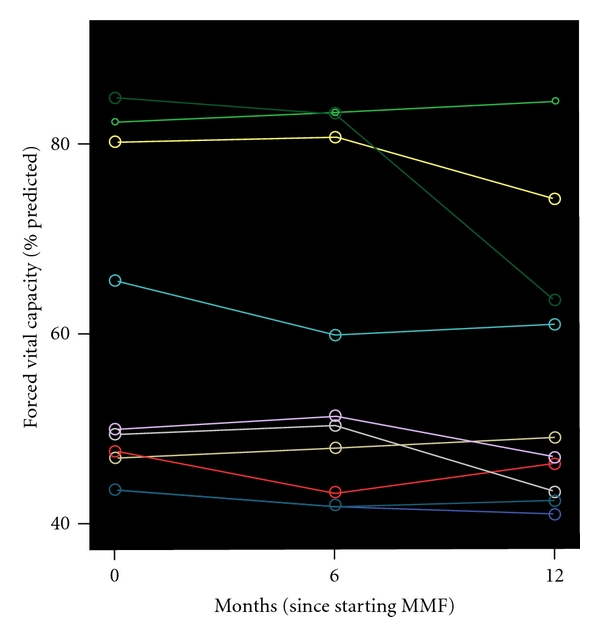
Forced vital capacity (FVC) fluctuations over time for each subject. Each line represents measurements made in a single subject. A time point 0 month indicates when MMF treatment was commenced.

Forced vital capacity (FVC) fluctuations over time for each subject. Each line represents measurements made in a single subject. A time point 0 month indicates when MMF treatment was commenced.