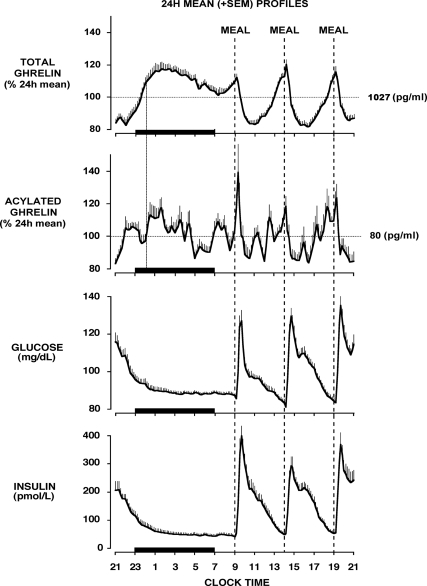
Fig. 1.
Twenty-four-hour mean (±se) profiles of total ghrelin, acylated ghrelin, glucose, and insulin obtained in healthy young men who were allowed to sleep from 2300 to 0700 h. The meal included identical carbohydrate-rich meals presented at 5-h intervals (0900, 1400, and 1900 h). The dotted line represents the occurrence of a hypothetical fourth identical meal 5 h after the dinner meal, i.e. at midnight. The black bars represent the sleep period.

