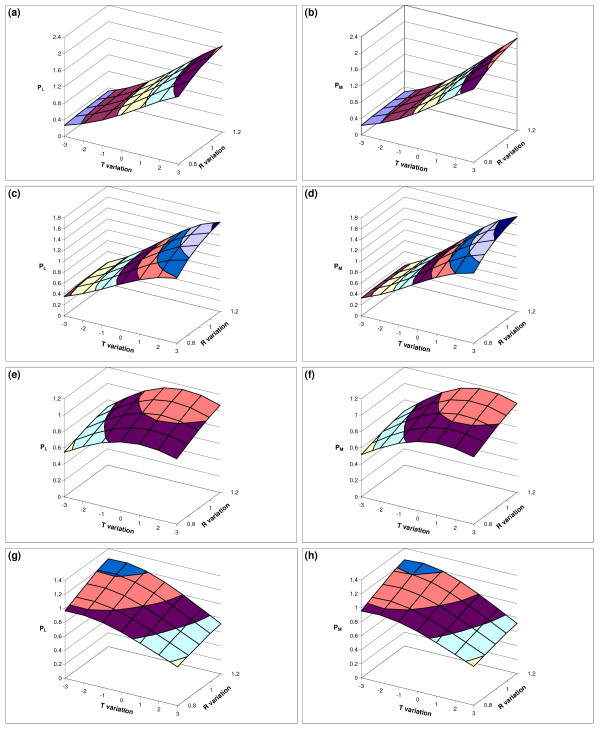
Figure 5.
Results of the sensitivity analysis. Results of the sensitivity analysis to temperature and rainfall variation. The indexes of variation of population abundance for both immature and adult mosquito are shown for each modified climatic regime (T variation × R variation). The selected index represents the abundance variation for immature (left) and adult (right) with respect to the reference standard, the average value calculated for the original time series of meteorological data. Pictures (a),(b) refer to the Nairobi site, (c),(d) to Nyabondo, (e),(f) to Kibwesi, (g),(h) to Malindi.

