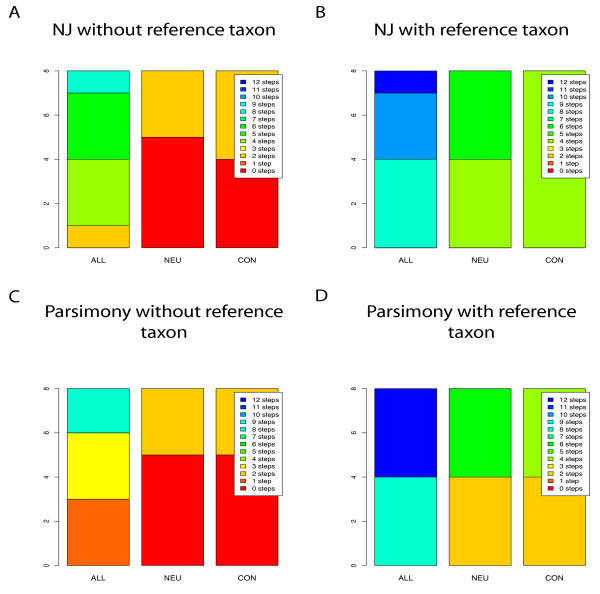
Figure 4.
Results for MPP based NJ and Parsimony Analysis. The stacked histograms show the SymD measures of trees constructed using the MPP method for the sixteen different iterations detailed in Additional File 1: table S1 - representing the various options available in the MPP program. The binary matrices constructed by MPP were output to PAUP and used to make parsimony-based trees (Figures 4 C and D). From each binary matrix a distance matrix was calculated from each of these sixteen matrices using the cghdist option in the MPP GUI, and a Neighbor-Joining (NJ) tree was calculated using PAUP excluding (Figure 4A) and including (Figure 4B) the reference taxon, N. crassa A. This data is also given table form in Additional File 4: table S4.

