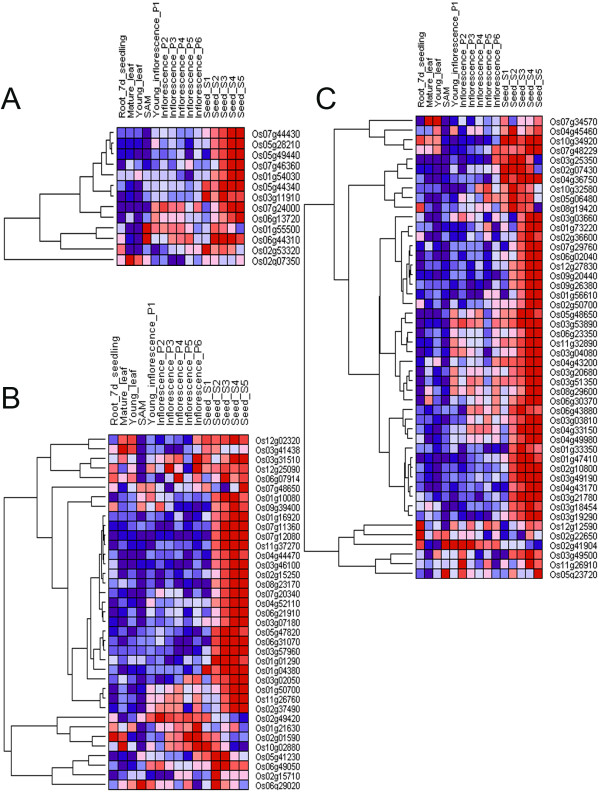
Figure 4.
Homologous genes of rice grouped in clusters according to their expression patterns in different organs. (A) 13 of 98 genes show high similarity (B) 37 of 98 genes show weak similarity (C) 48 of 98 genes show moderate similarity. The accession number of each gene was listed on the right. The hierarchical cluster color code: the largest values are displayed as the reddest (hot), the smallest values are displayed as the bluest (cool), and the intermediate values are a lighter color of either blue or red. Pearson correlation clustering was used to group the developmentally regulated genes.

