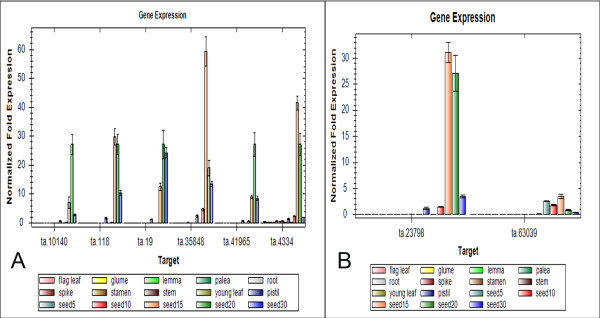
Figure 5.
qRT-PCR analysis of the expression profiles of eight genes selected from in silico screening results. (A) Six unigenes isolated by the combination of DDD selection and microarray data analysis. (B) Two unigenes isolated only by DDD selection. The x-axis of each gene represents for different tissues or organs. The bars above each gene name indicate different tissues or organs with a single color. The order from left to right is: flag leaf, glume, lemma, palea, root, spike, stamen, stem, young leaf, pistil, seed5, seed10, seed15, seed20 and seed30. The y-axis shows the gene expression levels after normalization to reference genes Ta.54227 and Ta.2291.

