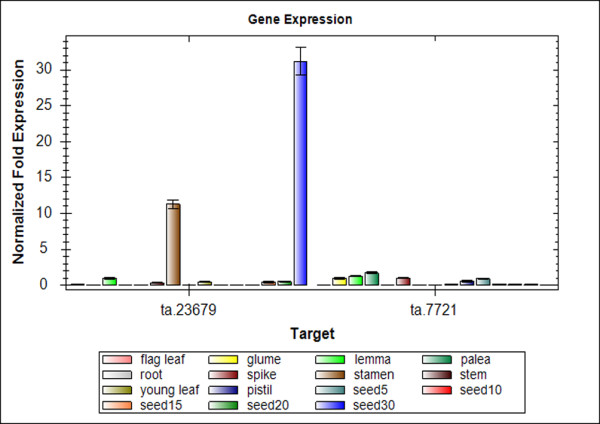
Figure 6.

qRT-PCR analysis of two genes which didn't meet the formula in the selection of DDD. The bars above each gene name indicate different tissues or organs with a single color. The order from left to right is: flag leaf, glume, lemma, palea, root, spike, stamen, stem, young leaf, pistil, seed5, seed10, seed15, seed20 and seed30. The y-axis shows the gene expression levels after normalization to reference genes ta.54227 and ta.2291
