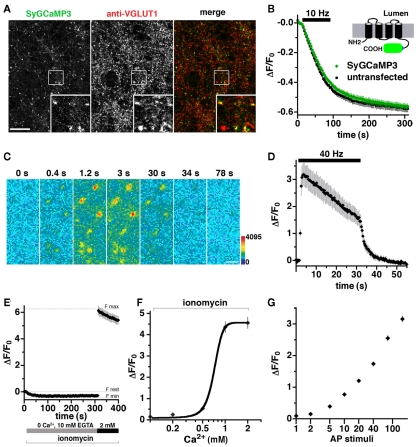
Figure 2.
Development of a GCaMP3-based presynaptic calcium indicator. (A) Fluorescence of SyGCaMP3 colocalizes with antibody against endogenous VGLUT1 at synaptic varicosities. Inset shows a 4× magnification of the designated box. Size bar, 10 μm. (B) The rate of FM4-64 destaining is not significantly different between boutons from untransfected (black) and transfected (green) neurons. Inset: schematic of SyGCaMP3 showing fusion of the GECI to the cytosolic C-terminus of synaptophysin. (C) Time-lapse imaging of SyGCaMP3 fluorescence changes in response to stimulation at 40 Hz for 30 s. After onset of the stimulus, SyGCaMP3 in hippocampal neurons exhibits a rapid increase in fluorescence (0.4, 1.2, and 3 s), followed by a decay during (30 s), and after the stimulus (34 and 78 s). Color scale is shown to the right. Scale bar, 2 μm. (D) Time course of changes in average fluorescence intensity at boutons expressing SyGCaMP3 during and after stimulation at 40 Hz for 30 s. Images are collected every 400 ms. (E) The minimum synaptic fluorescence of SyGCaMP3 (Fmin) in transfected hippocampal neurons was determined by perfusion of modified Tyrode’s solution containing the calcium ionophore ionomycin (5 μm), 0 Ca2+, and 10 mM EGTA, resulting in a decrease of ΔF/F0 = −0.35 ± 0.03 relative to the resting condition (modified Tyrode’s containing 2 mM CaCl2 without ionomycin, Frest). The maximum fluorescence change (Fmax) in the presence of ionomycin and 2 mM CaCl2 is ΔF/F0 = 6.15 ± 0.35. (F) Semi-logarithmic plot of fluorescence responses to increasing CaCl2 concentration. (G) Semi-logarithmic plot of integrated fluorescence responses to trains of 1, 2, 5, 10, 20, 40, 80, and 160 action potential (AP) stimuli at 80 Hz. Data in (B, D, E, F, and G) are mean ΔF/F0 ± SEM from at least 30 boutons per coverslip from 7 to 12 coverslips and at least two independent cultures.

