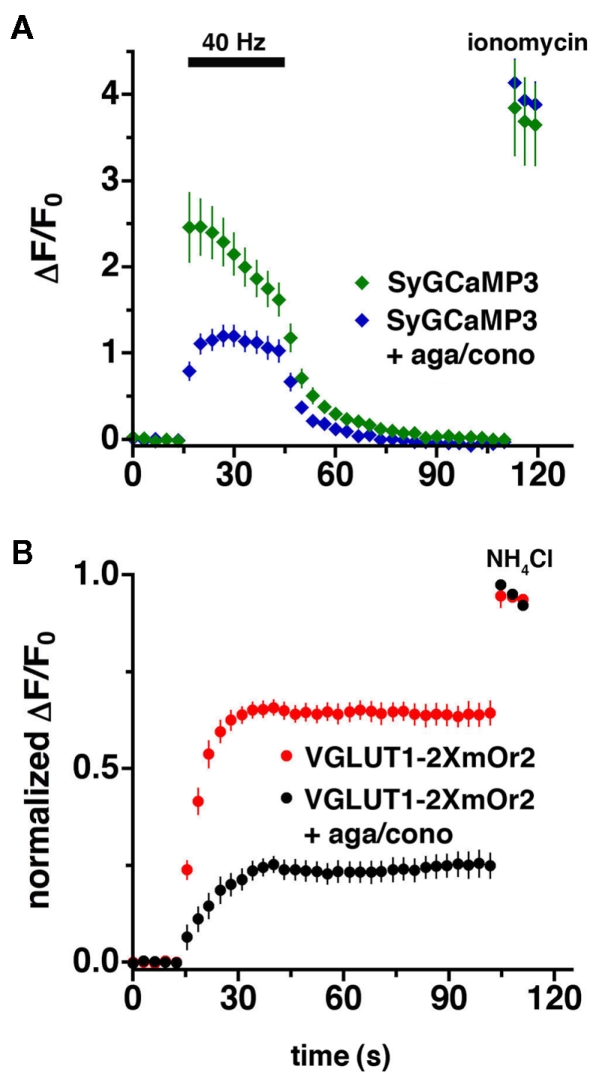
Figure 3.
Imaging of VGLUT1-2xmOr2 and SyCaMP3 during exocytosis. The average time course of changes in fluorescence intensity at boutons expressing both (A) SyGCaMP3 and (B) VGLUT1-2XmOr2 in the absence (green, red) and presence (blue, black) of agatoxin and conotoxin during and after stimulation at 40 Hz for 30 s. The increase in fluorescence produced by 40 Hz stimulation in the presence of bafilomycin is shown here corrected for the rate of fluorescence increase produced by the drug in the absence of stimulation (Sankaranarayanan and Ryan, 2000; Voglmaier et al., 2006). In the presence of the P/Q- and N-type Ca2+ channel blockers, ω-agatoxin TK (300 nM), and ω-conotoxin GVIA (1 μM), the peak fluorescence of both VGLUT1-2XmOr2 (black) and SyGCaMP3 (blue) is decreased. Data are means ± SEM of the change in fluorescence (ΔF) normalized to initial fluorescence over at least 30 boutons per coverslip from 7 to 12 coverslips and at least three independent cultures.

