
Figure 7.
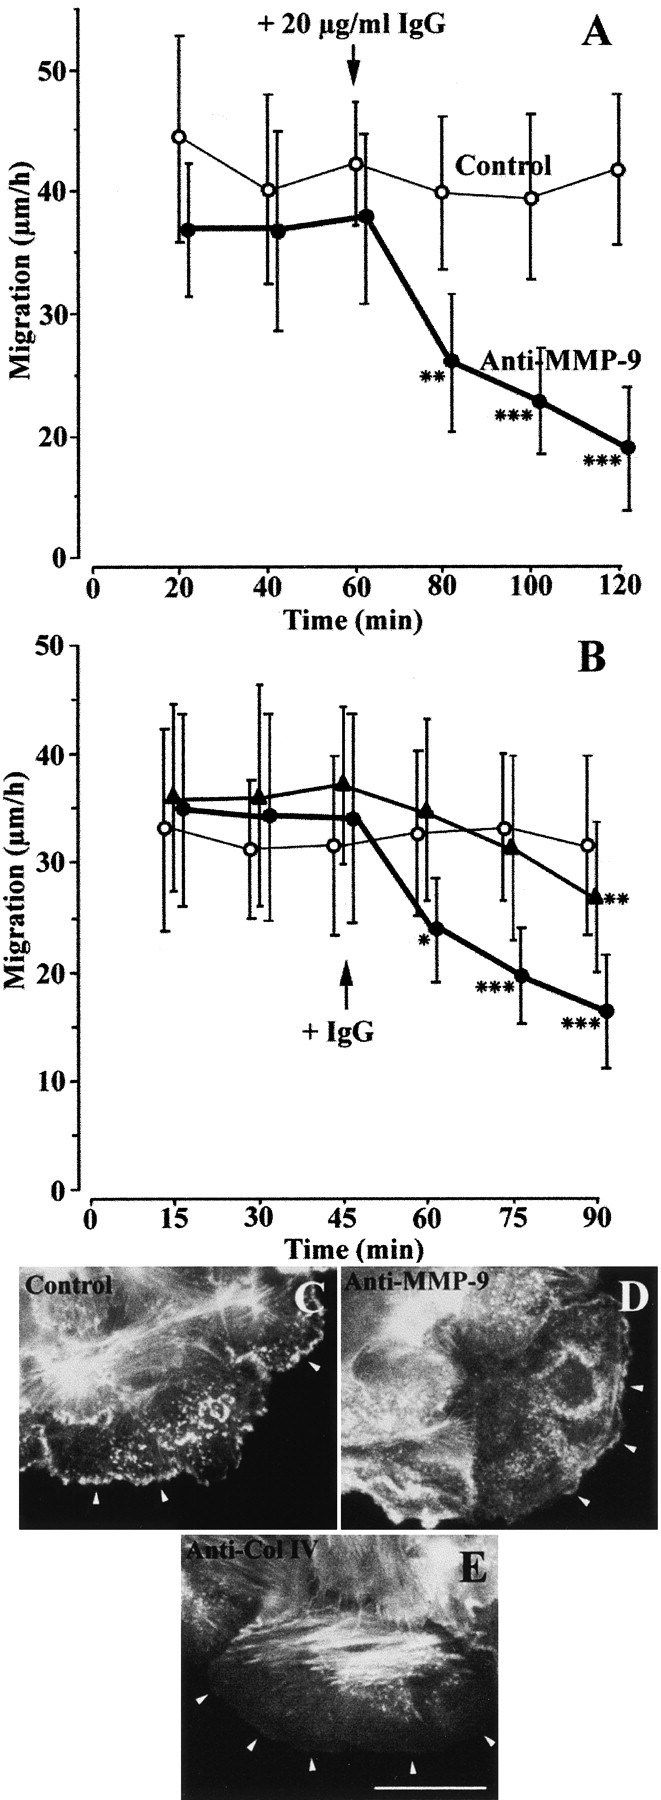
Anti–MMP-9 or anti–collagen IV Ab inhibits HBEC migration. (A and B) 1 d after injuring primary cultures of HBEC, cell migration was measured after fluorescent labeling of cell nuclei, as described in Materials and Methods. Migration speeds of the cells (n = 20) located at the edge of the wound were determined every 20 min (A) or 15 min (B) over a 60-min (A) or 45-min (B) control period. (A) At 60 min, 20 μg/ml of 6-6B anti–MMP-9 mAb (closed circles) or 20 μg/ml of control mouse IgG (open circles) was added to the culture medium and the migration speeds of the same cells were monitored over an additional 60-min period. (B) At 45 min, 30 μg/ml (closed circles) or 15 μg/ml (closed triangles) of anti–collagen IV Ab or 30 μg/ml of control IgG (open circles) was added to the culture medium, and the migration speeds of the same cells were monitored for an additional 45-min period. Each bar represents the mean ± SD of the migration speed of 20 cells. Cell migration at each time and in the presence of Ab was compared (paired t test) to cell migration during the control period: *P < 0.05, **P < 0.01, ***P < 0.001. (C–E) FITC–phalloidin labeling of actin in a culture exposed to a control Ab (C), the anti–MMP-9 6-6B mAb (D), or the anti–collagen IV Ab (E). In C and D, numerous sites of intense actin labeling are seen at the tip of cell protrusions (arrowheads). After exposure to the anti–collagen IV Ab, actin labeling at the forefront of the cell became very faint (E, arrowheads), whereas strongly labeled microfilament bundles radiating from focal contacts remained in the central part of the cell. Bar, 40 μm.