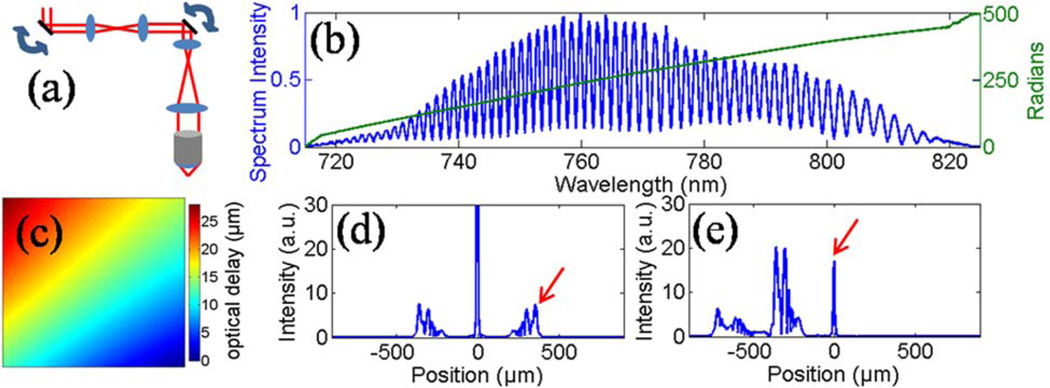
Fig. 2.
(Color online) (a) Schematic of the sample arm. (b) The spectral interference pattern and the unwrapped phase of the analytic signal with a mirror at the focus of the sample arm. (c) Image mapping the optical delay to the focal plane, showing the curvature of the coherence gate caused by scanning over an ~200 µm FOV. (d) FFT of the raw spectrum. (e) FFT after multiplying the spectrum by the conjugate of the measured spectral phase profile. The arrows indicate the focus depth.

