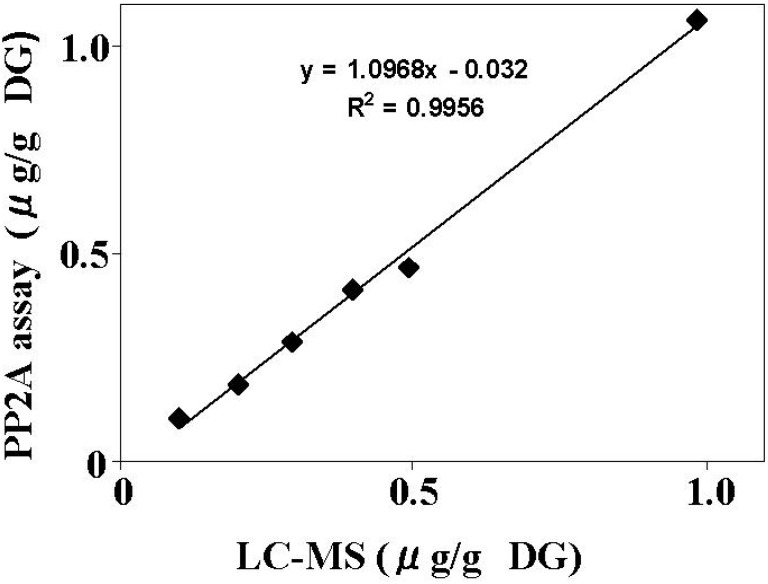
Figure 4.
Comparison of the PP2A inhibition assay and LC-MS analysis. The mussel DG was spiked with OA at concentrations of 0.1, 0.2, 0.3, 0.4, 0.5 and 1 μg/g, and the extracts were subjected to the PP2A inhibition assay and LC/MS analysis. Each extract was measured in triplicate and the average value was compared between methods.

