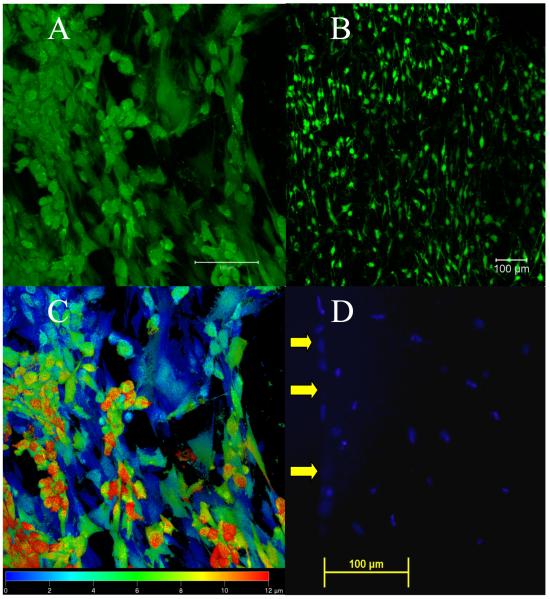
Figure 4.
Cell Viability and Migration: A, B and C: Confocal images of ADSCs on electrospun PLAGA scaffolds at 14 days post-seeding. (A) Staining with Live/Dead Assay shows cells with a flat morphology and extended processes, (scale bar = 100μm). (B) Staining with Live/Dead Assay shows at low magnification the ADSCs have adhered and proliferated throughout the scaffold surface, (scale bar = 100μm). (C) A false color confocal image indicating the depth of cells from the scaffold surface (20x). Blue is indicative of cells at the surface and red indicates that cells extend to a depth of 12μm. (D) DAPI fluorescence image of cell nuclei showing ADSCs up to 200μm from the scaffold surface. Yellow arrows point to the surface of the scaffold.

