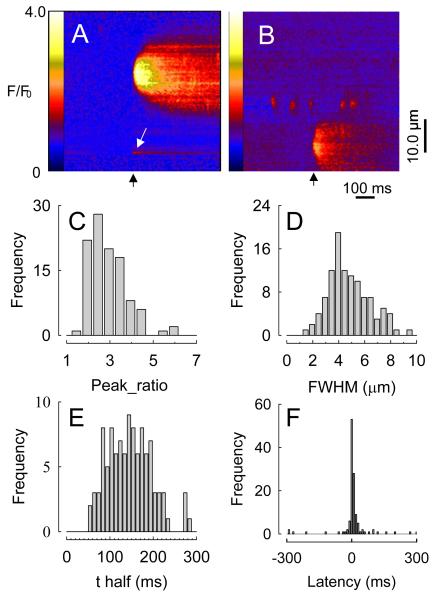
Figure 1. Junctional Ca2+ transients in line-scan images, expressed as fluorescence pseudo-ratios (F/F0).
A, Black arrow indicates time of stimulus pulse. White arrow indicates (unrelated) nerve fiber Ca2+ transient. B, jCaT with spontaneous Ca2+ sparks. C through E, Probability density histograms of peak F/F0, FWHM, and t1/2 for all jCaTs (F). Probability density histogram of latencies of all jCaTs, showing a few spontaneous jCaTs (Lamont & Wier, 2002).

