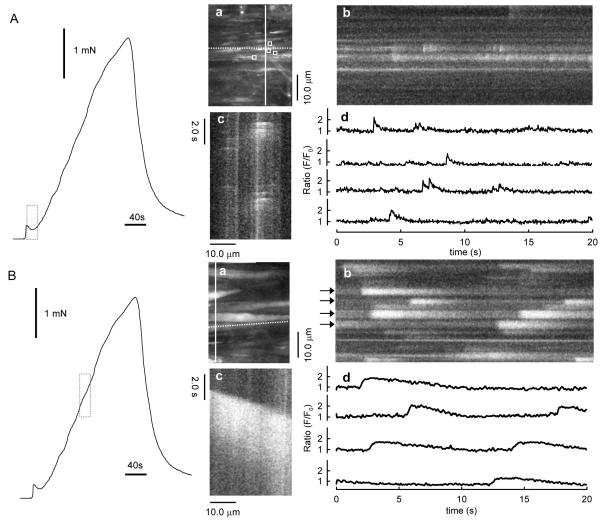
Figure 2. Occurrence of jCaTs during the predominantly purinergic component (A) and Ca2+ waves during the predominantly adrenergic component (B) of neurogenic contraction.
Records at left of both (A) and (B) are the force produced by EFS for 3 minutes. The dotted vertical bars indicate the times during which images in (a)–(c) and traces in (d) were obtained. (Aa and Ba) Image obtained by averaging 30 frames (1s) during the period indicated. Ab and Bb are virtual line-scan images derived from a selected single vertical line of pixels in images Aa and Bb, respectively (solid white line). Ac and Bc are virtual line-scan images derived from a single horizontal line of pixels in images Aa and Ba, respectively (dotted white line). Traces in (Ad) are fluorescence pseudo-ratios (F/F0) derived from the average fluorescence within selected areas-of-interest (AOIs) in the images in Aa (white boxes). Traces in (Bd) are derived from the line-scan image in Bb, at the lines indicated by the black arrows. All the data illustrated here were obtained at 30 images s−1 (Lamont et al., 2003).

