
Figure 1.
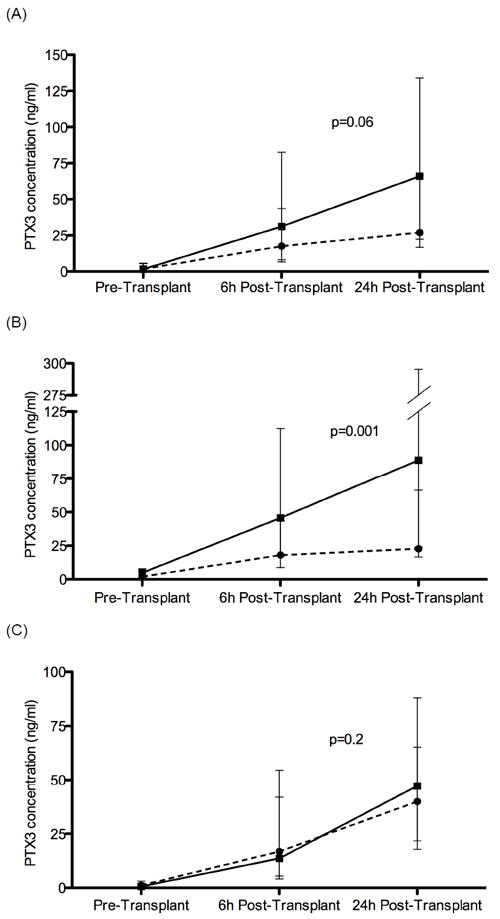
Longitudinal median PTX3 level across the pre-transplant, 6-h post-transplant, and 24-h post-transplant time points.
(a) all study subjects, (b) subjects with IPF, (c) subjects with COPD Solid line represents PGD-cases and dashed line represents PGD-free controls. Error bars represent the 95% CI. P-value reported is from GEE modeling.