
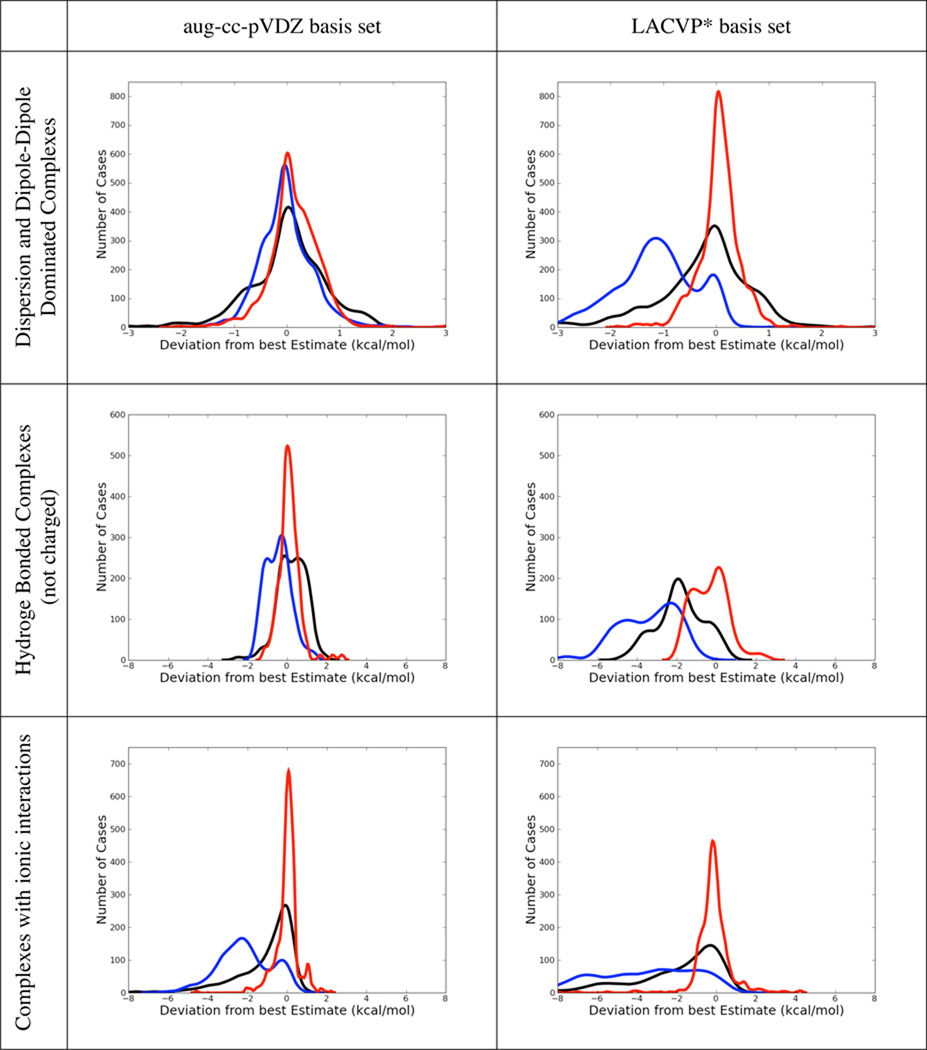
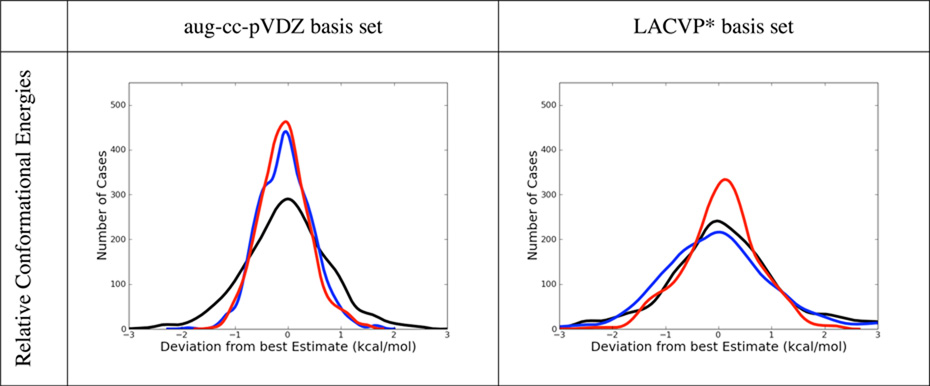
Table 8.
Comparison of Error Distributions of B3LYP-MM (red), B3LYP-D3 (blue) and M06-2X (black). All results are without explicit counterpoise corrections. All plots show normalized kernel density estimates (kdes) multiplied with the number of datapoints. The kdes were computed with the density() function in R, with gaussian kernels and default bandwidths,
 |
 |