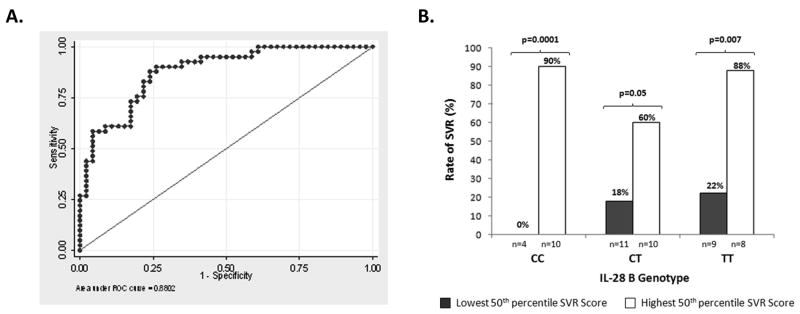
Figure 4.
Multivariate model to predict SVR.
The likelihood of SVR was calculated by combining four variables: race, log10 viral load and % of lymphocytes expressing NKG2A and CD158e as described in table 3. Receiver operating characteristics (ROC) of SVR model is shown (A). The ROC curve returns a c-statistic of 0.88. The SVR score model enhances the predictive value of IL-28 genotype. There were N=57 individuals with consent to use IL-28B data. Of these, n=52 had relevant data allowing calculation of SVR model score (B).

